Poisson distribution
date posted: 2020-06-28
Contents
What is Poisson distribution?
Poisson distribution is used for calculating probability of event happening within a certain range where range can be time or space. Space can have multiple dimensions, cars passing by a highway checkpoint is an example of one dimension, flowers in meadows is two dimensions and stars in region of galaxy is example of three dimensions.
Just like other distributions we've looked at in order to use poisson distribution formula our data must create poisson distribution and in order to do that two conditions must be met:
- Events occurring within a range(time or space) must be independent.
ex: % of machine breaking within one week where breaking does not affect next break. - Mean number of event happening within given range must be known
ex: on average machine breaks 3 times within a week.
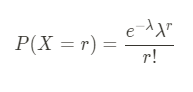
where
λ = mean number of event happening within a range.
r = random variable.
One more thing to note is expected value and variance of Poisson distribution.
E(X) refers to number of event occurring in given range which is simply λ. Similarily Var(X) of Poisson
distribution is λ.
E(X) = Var(X) = λ in Poisson distribution.
Example question
Q: Find the probability of 3 cars passing a highway checkpoint in 60 seconds where on average 10 cars pass highway checkpoint in 60 seconds.
For simplicity I am not going to consider rush hours and treat every minutes to have same mean number of cars passing.
i) cars passing by are independent of each other.
ii) mean value of cars passing by within given range (60seconds) is known.
Both conditions of Poisson distribution are met therefore we could use Poisson distribution probability function.
Our mean value(λ) is 10 cars/60seconds and now we want to know probability of 3 cars passing by
in 60 seconds, 3 is our random variable. All variables are known, plug them into the formula.
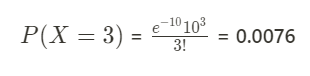
Probability of 3 cars passing by highway checkpoint within 60 seconds is 0.76%.
As mentioned in the beginning Poisson distribution can be applied to higher dimensions which makes it very powerful tool for solving real world problems.
Poisson distribution to approximate binomial distribution
Another use case of Poisson distribution is that we could use it to approximate value of binomial distribution.
Why? Binomial distribution formula require calculation of
high number factorials making calculations hard.
When? Poisson distribution can be used to approximate values of Binomial distribution when n >= 50 and p < 0.1, that is when there are
large enough samples and probability of success is low.
How? In binomial distribution problem we would be given values for n, p and have E(X) = np therefore we can
simply substitute np with λ if we want to substitute binomial distribution with
poisson distribution. E(X) = np = λ, expected value in Poisson distribution.
Now we know why, when and how lets go over with an example.
Example question 2
Q: you are given a test with 60 questions where for each question your probability of answering correctly is 0.05 :( , What is the probability that you will get 5 questions correct?
This is binomial distribution problem where n = 60, p = 0.05.

Notice in factorial calculation numbers are pretty large and as n gets higher and higher it will become larger therefore much harder to fit into calculator and definitely not easy to do by hand. Even though there are computers that solve factorials efficiently it is a good practice to know how we could use simpler method :).
This using Poisson distribution. We know E(X) = np = λ therefore E(X) = 60*0.05 = 3.
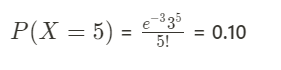
Probability of getting 5 questions correct in 60 questions is 10%.
This time we dealt with much smaller number making calculations easier. Notice that both formula outputted same answer. As n gets larger and
p gets smaller Poisson distribution will do a better job of approximating binomial distribution. Which
also means it will look more like Binomial distribution as n gets largers and p gets smaller.
This time I didn't explain how Poisson distribution density function was derived as it requires deep mathematical understanding however I will try to post it for those interested (once I understand it myself).