K-Nearest Neighbors
date posted: 2020-08-15
Contents
K-Nearest Neighbors
KNN is a supervised machine learning algorithm where we do not have to fit training data to our model.
It is fairly simple algorithm however choosing K, choosing right measurement for similarity, and seeing how good a model is not so simple.
KNN predicts target variable depending by looking at its most simliar(closest) K datas. For example when K=1 it would look at first most closest data and predict that our new data and its closest data will have same target variable. When K > 1 it would choose K number of data closest to new data and select majority group(classification) or average value from closest K datas (regression).
Now we have an understanding of what KNN is I go through an example and talk about things that you should be careful of. But before that I will explain different measurement we could use to define simliarity.
Similarity measure
There are multiple ways of calculating similarity between two data points however I will only talk about two most used and simple measures.
Euclidean distance
Straight line connecting two points. Say you have data point p and q. To find euclidean distance between the two we substract each feature one from another, square them, sum all squared differences and take the square root.
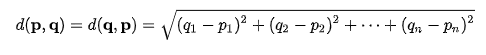
So no matter how many features we have we can calculate similairty without reducing dimensions.
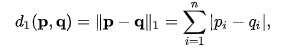
Manhattan distance
Distance measured by moving in one direction at a time. Think of walking from one point to another point in Manhattan, you cannot cut through buildings therefore you need to follow the path, either right-left or up-down. It is also referred to as taxicab geometry.
You can get Manhattan distance by summing absolute valued differences. Say we have data p and q then we get following formula where i refers to ith feature in each data.
Classification example
Import necessary libraries and retrieve Iris data from sklearn.
from sklearn import decomposition
from sklearn.datasets import load_iris
from sklearn.metrics import accuracy_score
from sklearn.model_selection import train_test_split
from sklearn.neighbors import KNeighborsClassifier
import pandas as pd

data = load_iris()
data is a dictionary with data, target_variable, target_names, and other informations about the data therefore print(data) to see what it offers.
Get independent variables(X) and dependent variable(y). Note that flower types are in numbers but if you print(data) you could see that 0 = "setosa", 1 = "versicolor", and 2 = "virginica". I will not change them to their names because later on we need them to be in integers so that we could label them with different colors in a graph.
X = pd.DataFrame(data.data, columns=data.feature_names)
y = pd.DataFrame(data.target).rename(columns = {0:"flower_type"})
Now we have our data, split into train, test set (note that knn doesn't really need prediction as it just needs to find K closest data from dataset)
X_train, X_test, y_train, y_test = train_test_split(X, y)
knn = KNeighborsClassifier(n_neighbors=5, p=2, metric="minkowski")

knn.fit(X_train, y_train.values.ravel())
y_pred = knn.predict(X_test)
n_neighbors = K, p = Power parameter for Minkowski metric, when p=1 it is using manhattan distance and when p=2 it uses euclidean distance to calulate simliarity.
So our KNN has K=5 and using Euclidean distance to find simliar 5 data points. After it will assign X_test's y_value with majority y value from 5 closest data points.
We measure our model performance by seeing how many correct y-values it got.
accuracy_score(y_pred, y_test)accuracy_score is simply correct/correct + wrong. I could write my own accuracy_score function.
def accuracy_score(y_pred, y_test):
    correct_prediction = 0
    wrong_prediciton = 0
    for prediction, actual in zip(y_pred, y_test["flower_type"]):
        if actual == prediction:
            correct_prediction += 1
        else:
            wrong_prediciton += 1
    return correct_prediction/len(y_test)
We've just used KNN to classify flower type, it seems very simple but here are some important things to keep in mind:
- Independent variables must be scaled
- Do not measure model performance solely on accuracy score
For example:
- A: $50000 income, 30 years old
- B: $20000 income, 25 years old
calculating euclidean distance we would get sqrt((50000-20000)^2 + (30-25)^2). As you can see age would not affect distance value compared to income. Therefore you must standardize so that all features share same range => same importance.
Model performance
For all classification algorithms it is always best practice to look at multiple metrics when measuring model performance. Even though your model has 99% accuracy that doesn't mean you should always use that model, this holds stronger when there exists class imbalance => target variables do not share same proportion.
For example if you are building a model that predicts cancer simply predicting "No cancer" for all patients will still result in high accuracy due to rareness of cancers therefore looking solely on accuracy is not a good measure.
In addition to accuracy score there are other metrics to consider, however I will talk about two things specificity and sensitivity.
Sensitivity = True positive / True positive + False negative. Used when predicting correctly is utmost importance
Specificity = True negative / True negative + False positive. Correctly identifying negative outcomes.
True implies model's correct prediction and positive refers to whether it guessed True, "Yes cancer", etc... (depends on what you choose to be positive.). For example if correctly identifying cancer is positive, given new patient if your model predicts as "Yes cancer" True positive if actually cancer patient and False positive if patient is healthy.
Since there exists trade-off between sensitivity and specificity you need to choose whether to increase sensitivity or specificty depending on question you are trying to answer. For example in cancer detection you would not want to miss cancer detection therefore incresing sensitivity would be more important. Where as in spam detection wrongly classifying spam as ham would not be detrimental.
How to choose optimal K?
We can choose K by using n-fold cross-validation technique, that is splitting train data into n group, train on n-1 group and test on nth group. Repeat this n times with different values of K and use K that led to best result on our test set.
When K is low we are prone to overfitting, say K=1 then even though data is an outlier it will still get assigned to closest data and if K is too high it oversmooth data therefore cannot capture local structure in the data, main advantage of knn.
Typically when dataset has lots of outliers/noise high K value works better and when there are little or none outliers/noise smaller K works better.
Lastly it is a good idea to choose odd number K value to avoid ties.
Finally, though KNN is simple to understand don't forget:
- Need to choose K depending on your dataset using cross validation technique
- Scale features so that one feature does not dominate others
- Don't look at only accuracy score, consider other metrics such as sensitivity, specificity, f1 score, etc...